


As to profit target I will change the phrase so that it does not confuse us. When planning my trade I talk about a first profit target and not profit taking as I don’t have the deal open yet. I will talk about profit target area as I don’t work to the exact pip. If the price level which are say at 1.3000 is the profit target I have in mind when planning the trade I never set my actual profit taking at 1.3000 as that is where the price sometimes turn around and you miss the profit with 2 to 3 pips. I use an area 5-10 pips away to taken profit. If my estimate of profit is 30 pips I will never let a 25 pip gain become a loss. I will close 40%-50% on 25 pips gain and then either set the remainder on breakeven or use the 25 pip gain to set the stoploss on the remainder to 25 so that when that is hit I will break even on total. I will only do the latter if I am convinced that there is potential for further moves otherwise I cash in 40-50% and set the rest at breakeven. There are so many deals coming that by taking partial profits and the rest is taken out at breakeven you can manage 100+ pips a month just on the partial profits made. When the setup does not look like the perfect setup one must know that it can go wrong so take early profits and make sure that the worst should be breakeven or a very minor loss. That is part of money management.
The setup to the EurUsd you people took was not a wrong decision. It wasn’t the
 perfect round top. I wasn’t live at that stage so I also might have taken it although I did
not like the looks of it. I was however very aware of a shooting star that goes beyond the
trendline as we are on strong resistance area as you have also stated. They know the short
deals are in and the stops is above the trendline. Just look at history and see how many
times at resistance/support you get a penetration of that. There is two set of stops taken out. The ones that went short and the ones that put in orders for the breakout trade. So by piercing the trendline they trigger the breakout orders and take out the stops of the short orders and then the price comes down taking out the stops of the breakout orders. Two in one. Not bad for whosoever is doing this. Might be the big guys. Have not met one of them yet. Just be aware of this. When you see that action you know what the true direction Take it on. That is what I did yesterday on the EurUsd when the price came back to 1.3030 I took it on with a stop of 33 as the damage was already done by them. The tail is not reflected in the MACD as the close of the candle is nicely back within the channel or trendline. Just be aware of this. Those tails serves as beacons to me especially if they occur at strong trendline, pricelevel, moving average etc. support or resistance levels. If the MACD shows a signal with it (it normally does) I talk on.

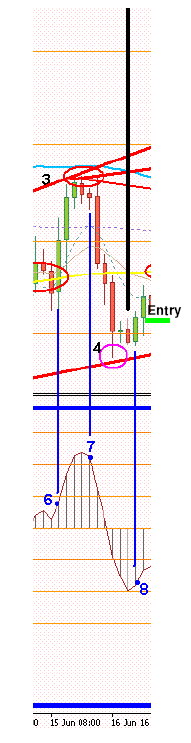
200SMA. MACD make higher bar. No definite pattern. Only high probability trade.

2. Price closed above 200SMA on signal candle.
3. This is a high probability trade.
4. Profit target is between 8EMA, 365EMA and price level 1.2100 = 40-60 pips
5. Entry @ 1.2060
6. Profit @ 50% at 1.2090 and rest at 1.2110
7. Stoploss @ 1.2020
8. Risk = 40 pips for 30 pips(50%) and 50 pips(50%) for a total average of 40 pips gain.
9. Risk reward ratio of 1 : 1. (OK for MACD system)
Take the odds on
DEAL 2::
1. MACD shows a continuation pattern. The price went down through the 89SMA an has

pulled back in between the 8EMA and 21EMA.
2. It closed on the 200SMA which can be support.
3. The signal bar is an engulfing candle together in a evening star.
4. Profit target is price level 1.2000 = ±45 pips
5. Entry @ 1.2048
6. Profit @ 50% at 1.2018 and rest at 1.2005
7. Stoploss @ 1.2086 (38 pips)
8. Risk = 38 pips for 30 pips(50%) and 43 pips(50%) for a total average of 35 pips gain.
9. Risk reward ratio of 1 : 0.92. (OK for MACD system)
Take the odds on
DEAL 3::
1. MACD makes higher low.
2. Previous candle a spinner????. Shooting down. Somebody is buying of the lows

pushing the price higher.
3. Signal candle find support on price level 1.2000
4. Profit target is to 89SMA = 33 pips with stoploss at 1.1964 = 50 pips
5. Easy calculation. Risk to reward of 1 : 0.66 BAD (Must be greater than 1 : 0.9)
No deal at all:
DEAL 4::
 1. MACD turns down indicating down move. Possible second higher low. Wait to go lower
1. MACD makes second higher low.

2. Signal candle filled the gap of deal 4 and is very strong. Good signal
3. Stoploss to below low is ±65 pips. To big. Use three stage entry rules at
open of next candle plus 30% and 45% retracement of signal candle.
4. Signal candle width ± 68 pips. 30%=20 and 45%=30 more or less. Enter 0.2
lots at 1.2020 ---- 0.4 lots at 1.2000 (1.2020-30%) --- and 0.4 lots at 1.1990 (40% lower)
5. Entries at 1.2020, 1.2000 and 1.1990
6. Average entry level ± 1.2000
7. Stoploss at 1.1950 = 50 pips
8. Profit target between 200SMA and 21EMA = ±50 pips (±1.2065)
9. Risk reward of 1:1 OK
10. Total of 45 pips @ .2 --- 65 pips @ .4 and 75 pips @ .4 = 65 pips gain
Might not get filled on all three deals as it my turn up above our 45% retracement level. If so add
rest when price moves back past 30%(1.2000). This is optional.
Take the odds on:
DEAL 6::
1. MACD makes continuation pattern.
2. Signal candle strong engulfing. Good sign.
3. Stoploss to below 200SMA where the price found support..

4. Entry at 1.2100
5. Stoploss at 1.2052 = 48 pips
6. Profit target 89SMA = ±70 pips (1.2165) = 65 pips gain.
9. Risk reward of 1:1.45 OK
Entry Take the odds on:
Nottes::
Although there is pricelevel 1.2100 and 365EMA presence the candle giving the signal
is a strong candle and the distance to the profit target 89SMA is 70+ pips so the risk reward is OK.
DEAL 7::
1. MACD makes aggressive reversal pattern. (Round top/bottom I like it to form over at least

4-5 candles). The looks of the pattern is OK.
2. Found resistance almost against 89SMA. Good sign.
3. Stoploss to above 89SMA = 38 pips
4. Entry at 1.2155
5. Stoploss at 1.2193 = 38 pips
6. Profit target 1.2100 or 200SMA (1.2070) which will be the case as it found
support/resistance at 200SMA previously = 85 pips gain. Max. (65 definite)
7. Risk reward of 1:1.45 OK
Take the odds on:
Nottes::
This was a good deal and I liked the small candles that were made around the resistance
Area when the signal was given by the MACD.
DEAL 8::
1. MACD makes Aggressive Reversal (V-bottom). 16:00 Candle has a tail.
2. Found support on 1.2000. Good sign.
3. Stoploss to below resent low 1.1975
4. Entry at 1.2018
5. Stoploss at 1.1975 = 43 pips
6. Profit target 1.2060 or 89SMA. = 20 pips gain (See notes)
7. Risk reward of 1:1 OK
Take the odds on:
Nottes::
The price went up 32 pips and then turned around to entry level again. If you had gutts
and left it, it went up to the 89SMA. My style would have seen me taking profit at 20 pips on the down
coming of the price. Gain then would have been 20 pips.
DEAL 9::
1. MACD towards Zero then move away.
2. Found resistance against 2000SMA 3 times. Good sign.

3. Stoploss to above 89SMA = 48 pips
4. Entry at 1.2024
5. Stoploss at 1.2172 = 48 pips
6. Profit target 1.2000 or trendline area
7. Risk reward of 1:0.5 BAD (48 risk for 24 profit)
8. = 20 pips gain (See notes)
Risky deal but yes:
Nottes::
If I really wanted to do the deal as the motion looks good and it makes nice lower candles
I would have set my stoploss just above the 21EMA 29-30 pips away and then the 20 profit downwards
was on and my risk on the loosing side reduced. Just another way of doing it. It pulled back to the 21EMA
and then came down. Good sign.
DEAL 10::
1. MACD makes a higher low and then break above zero as it close. Strong sign
2. Found support at the trendline and 1.2100. Makes inside candle on previous

candle. Good sign. Signal candle very large(100+ pips) It closes against
365EMA possible up side to 89SMA(40 pips). If positive news made the move
then take it on with stop set to 28 max just to get the risk:reward ratio OK.
= 20 pips gain (See notes)
Very cautious one but yes:
Nottes::
The presence of the resistance of 365EMA and price level of 1.2100 scares me. The
positive ness of the signal candle is the only reason I will take the trade.
DEAL 11::
 1. MACD makes sort of round top. Signal candle closed right at 365EMA and
1. MACD makes trend continue(long).
2. Profit target to trendline and 89SMA to small.
No deal at all:
DEAL 13::
1. MACD makes lower high. Came of trendline resistance.

2. Stoploss to above trendline= 43 pips
3. Profit target 200SMA = 30 pips
4. Risk reward BAD
No deal at all:
Nottes::
Have you noticed the 89SMA and 200SMA are busy to bottleneck. Getting closer to each
other. That means it starts to squashes in between. A possible breakout is on the cards.
DEAL 14::
1. MACD down to zero and then moved up. Long signal.

2. Found support on the 200SMA. Good sign.
3. Stoploss to below 200SMA = 50 pips
4. Profit target to 89SMA and trendline = 15 pips BAD
No deal at all:
Nottes::
Have you noticed the 89SMA and 200SMA are busy to bottleneck. Getting closer to each
other. That means it starts to squashes in between. A possible breakout is on the cards.
It happened indeed but watch what happened. It broke through and then pulled back inside. See the
page containing the tail or sting. When you see that you take the reversal direction on.
DEAL 15::
1. MACD makes aggressive reversal signal after a sting-tail.

2. Pulled back into the previous zone it was in. Good sign.
3. Stoploss to just above the trendline it broke = 33 pips
4. Profit target to 200SMA = +40 pips (40 pips gain)
7. Risk reward. OK
Take the odds on:

DEAL 16::
1. MACD makes aggressive reversal signal(V-shape) and morning star. Good sign

New trendline drawn through point 11 to establish new Res/Support.
2. Found support almost against bottom trendline. Good sign.
3. Stoploss to below 200SMA = 48 pips
4. Profit target was difficult as the presence of the 89SMA was a warning sign but
the break of the trendline previously and the morning star mad me take the deal on
with target set to around 1.2200 pricelevel = ±80 pips
Actual gain = 53 pips gain. Max.
7. Risk reward of 1:1.45 OK
Take the odds on:
Nottes::
50% Profit taken after 50 gain and then rest put to a 20 trailing stop with profit
taking also set at 1.2190. Was taken out at 56 pips gain on remainder by trailing stop. Total gain
53 pips.
DEAL 17::
1. MACD aggressive reversal. Look OK

2. Found resistance 1.2190 price. Did not go to trendline
3. Stoploss to above 1.2190 = 48 pips (Large)
4. Profit target 89SMA = ±26 pips
5. Risk reward BAD
No deal at all.:
DEAL 18::
1. MACD down to zero and then moved up. Long signal

2. Found support on the 89SMA (Area marked XX). Good sign.
3. Stoploss to below signal candle = 43 pips
4. Profit target to trendline = ± 40 pips
Actual loss = 43pips loss. Max.
7. Risk reward OK
Take the odds on:
Nottes::
Our first loss after 17 possible trades of which 10 was taken. 1:10 win loss ratio.
Not bad. The area marked XX just shows how the 89SMA has now become support where up to
now it mainly played the role of resistance.
DEAL 19::
1. MACD makes lower high.
2. Found resistance on price level 1.2190. Previous nearby high. Good sign.

3. Stoploss to above price level 1.2190 = 28 pips
4. Profit target 89SMA and 364EMA = ±40 pips = 35 pips gain. Max.
7. Risk reward OK
Entry Take the odds on:
DEAL 20::
1. MACD down to zero and then moved up. Signal candle engulfing. Long signal

2. Found support of the 89SMA. Good sign.
3. Stoploss to below signal candle = 48 pips (Large)
4. Profit target to price level 1.2200 and trendline = 50 pips
45 pips gain.
7. Risk reward OK
Take the odds on:
DEAL 21::
1. MACD makes v-top(Not really aggressive reversal as it did not went high).
2. Found resistance against trendline. Good sign.
3. Stoploss to above trendline = +50 pips (NO GO)
4. Make use of three stages entry to reduce risk to below 50 pips
5. Profit target 1.2100, 200SMA, 365EMA = 60 pips
±15 pips gain. (with 3 stage entry)
7. Risk reward OK
Take the odds on:


34 Pips away from entry price. Will not let that turn into loss. It did
came back to just above entry level. What would you have done. I
Would have settled for 50% at 30 gain and set the rest at breakeven.
Total of 15 pips gain
It is hard to watch a 30 gain pulled back all the way to zero. I like to
take some profit early.
DEAL 22::
1. MACD makes aggressive reversal. Look OK
2. Found support on trendline with 4 candles. Very Good sign.

3. Stoploss to above below trendline. To big(>70). The 89SMA and the 200SMA were
broken by the signal candle. Set stop to 89SMA. = 48 pips
6. Profit target 1.2200 or trendline = 70 - 90
60 pips gain.
7. Risk reward OK
Take the odds on:
DEAL 23::
1. MACD makes round top.
2. Found resistance against 1.2200 pricelevel. Good sign.

Nottes::

Have a look at that tails-stings. Somebody is buying from the low of those candles.
summary 1. A TOTAL OF ±560 PIPS WAS OBTAINED OVER JUST 16 OR SO DAYS.
2. LOOK WHICH DEALS WAS POSSIBLE AS TO THE TIME YOU CAN TRADE
3. ALLOW FOR NOT GETTING FILLED AT THE EXACT OPENING OF THE NEXT
CANDLE PRICES.
4. ALLOW FOR PROFIT TAKING IN STAGES AS EVERYONE WONT TAKE PROFIT
AT THE SAME LEVELS ETC.
LETS SAY WE ALLOW FOR A TOTAL SLIPPAGE OF 30% WE STILL END UP WITH
ABOUT 400 PIPS OVER ALL THE DEALS.
IF WE CAN MANAGE THAT OVER A ZIG ZAG TIME LIKE THAT WHAT CAN BE
OBTAINED AND ACHIEVED WHEN THE MARKET IS TRENDING. YOU WILL BE
AMAZED. GO AND TEST IT.
I REALLY HOPE THAT YOU FOUND THIS WORTH SOMETHING POSITIVE.
LET ME KNOW ABOUT YOUR RATING AS I INTEND TO USE ALL THE MATERIAL
SO FAR IN TEACHING OTHER PEOPLE.
SO YOUR COMMENTS WILL BE APPRICIATED.


0 comments:
Post a Comment