rhythm trading

Wednesday, June 30, 2010

Right. Let's look at  that I've included there. It's about... I call it rhythm trading. Page 1, that triangle. We had three TC signals (well, number 3 was actually a zero break. Number 2 was a TC, which was a wrong deal, one of the very few where the MACD TC is wrong. Luckily, it was in the early morning. I was sleeping. I was on leave during that time, so I missed that trade. But, sometimes, sleep can keep you out of a bad trade as well. Number 1 was a beauty, but look what happens. Price was in a triangle, and then, all of a sudden, it broke out to the top above the 89, and then it pulled back towards the trend line. Actually, it went just a little bit through the 89. Then, it started moving back upwards at that capital A, that red A that I've got there. Now the MACD is only giving the signal on that huge candle, and a lot of people were waiting for that candle to close, because they were waiting for the MACD to give the signal. But it was all part of the market rhythm trading as we discussed on the thread itself. When the price breaks out, it tends to pull back to the breakout level and, then, carries on. That's exactly what happens there. After those three small candles there, I would have entered right on the 21 ema. I wouldn't even think twice, stop loss just below the trend line, and that's it. Target, the 200 sma. Remember, after a breakout, look for the pullback and then the carry on.


Right. Page number 2. Small triangle there. Look what happens there. Because the triangle is small, it gets support and resistance, bottom and top. There are a lot of tails inside the triangle. But, then, that nice little shooting star, that tail going out of the triangle to the top, and then it starts falling. I wouldn't even think twice. After the close of that candle, take the odds on for going down, stop loss just above the trend line or just above the body of that candle with a minimum of, I would say, about 25 pips. I wouldn't make the stop loss below 23, I would say. But beautiful indication there of what the market wants to do.


Page number 3. Look at that triangle. Look at the green lines, market rhythm. The price came from a to x, and then back to b, and then it came down to 1, below the 21 ema, that arrow just to the left-hand side, that's the 21 ema. The price went back up above the 21 ema, touching that top trend line, the a, b, 2 trend line, and then starts coming down all the way. And that's part of the rules at the end of an up move. You'll get that the price makes lower highs (a, b, and number 2 is lower highs; x and number 1 are lower lows) indicating that the price is going to come down. So, where do I enter? The MACD is giving just a zero break there. Beautiful signal. You take it; you come down to z for your profit target.


Page number 4. Look at that triangle. The price is caught between the 200 sma and the 89 sma. Look towards the end of the triangle. It gets bumpy because the price knows there's a lot of emotion that's got to build in there, that is building there, and the price needs direction. Now, it's going up and down. But look at those three circles there, getting support [resistance?] on the 89, the first two on that top trend line, and the third one did not go (I covered it a little bit with that green line), did not go to that trend line, just above the 89 sma. Remember that your last touch is the one that carries the most
weight, especially towards the end of the triangle. That's why I would look for a down move here. Look what happened. The price broke out. Then it pulled back towards the breakout level. It did not go to the trend line but to the 200 sma and the 21 and the 8 ema that was there. Then, it started moving down. People did not take that trade because of that huge signal candle on the MACD, but, that horizontal line, that h one, that's where I would have gotten involved because the rhythm trading was in place. The price did pull back to the 200. It starts moving down, and, when it gets to that horizontal line, I know the odds are in my favor that the rhythm trading is in place. It was a breakout level. There was a pullback and a continuation, and that's when I will switch to the one hour to get a nice entry place, and it is a nice stop loss. Look at the one hour, how it looks at that specific point, and then you enter the market there.


Right. Page 5. There's another triangle. Look towards the end. You can see candles getting up and downs, and then, on the MACD, there were three green TC signals towards the end. Now, that's what I'm trying to tell you people, to be careful within a triangle to watch its end. You might get some TC signals given, very slight. If you'll look at the difference between the MACD bars, you will find that it's hardly a TC given there. But, in this case, it would have worked out if you took it and put the stop loss just below that candle. On number a, number b, and number c, you would have been right, but what I wanted to show you here is that the price actually broke out. And, at that horizontal line, h, that's where I would have started looking to get involved if there was a pullback on the one hour. And, if you look at the inset, it just broke out and just went on. There was no safe chance to get in there, because remember, in that one hour, the price can move up and down 30 pips, 40 pips, and even take out your stop loss. So, I won't recommend going to a lower time frame. I have done thirty minutes to see whether the thirty minutes has given sort of a pull back and a nice move away to get in. I won't recommend that. You can do it if you've got experience on it, but this was no safe chance, what I would call it. There was no real safe chance where you could say, "Right, I can get into this trade safely, and I can let it run. So, that was a missed chance, and you're going to get those.


Right. What I want to say is that the MACD is there for confirmation. You cannot trade off the MACD solely. If you just trade TC’s, yes, but then you’re going to miss some huge candle trades because, normally, when the TC is there, what I’ve seen lately is the move, when it starts moving, the candles are big because there’s a lot of uncertainty of direction. That’s why the candles are big. You’ll get a slow down and then a big candle moving away, and that’s when the MACD is giving a TC. So, now we have to use market rhythm trading. You’ve got to know the market rhythm trading to really get involved. Like the trade I did on Friday, it’s to really analyze the whole situation to see for yourself what type of emotion is building up there. And what are the chances that it is going to do this or that? Then wait for confirmation in your candles, like a morning star, an engulfing candle, a hammer, or a shooting star, and, if the MACD is confirming that, then you’re lucky. You take it. But, sometimes that candle is big and it’s fast, moving away, but, when it starts moving and you’ve analyzed it and are satisfied that it is within the rhythm  trading of the market, you can switch to the one hour and get a better entry there.
So, it’s not just rhythm trading the one hour. It’s looking on the four hour, analyzing it. Get the rhythm trading correct. Get the candle emotion correct, and then switch to the one hour, when it starts doing the thing that you have analyzed that it might do. And, then, get in on a better price on the one hour. I hope this has helped you.
READ MORE - rhythm trading

today eur usd

Thursday, June 24, 2010

today eur usd Daily 12/04/2010 buy 1.3450-1.3550 stoploss1.3300 target 1.4000-1.4600


                                                            today eur usd daily 19/04/2010 buy 1.3400-1.3500 stoploss1.3200-1.3250 ,breakout 5 min,15 min,30min,1hour wait
                                                                today eur usd 30 min 20/04/2010 pullback wait

today eur usd 26/04/2010 1min strategy Attacking Support and Resistance


today eur usd 27/04/2010 1min strategy Attacking Support and Resistance
today eur usd 27/04/2010 30min breakout 
 
today eur usd 4h 27/04/2010
today eur usd 30 min breakout 30/04/2010 buy 1.3310-1.3320 stoploss 1.3240 tp1 1.3400

today eur usd 4hour breakout 30/04/2010
today eur usd 30/04/2010 1min strategy Attacking Support and Resistance
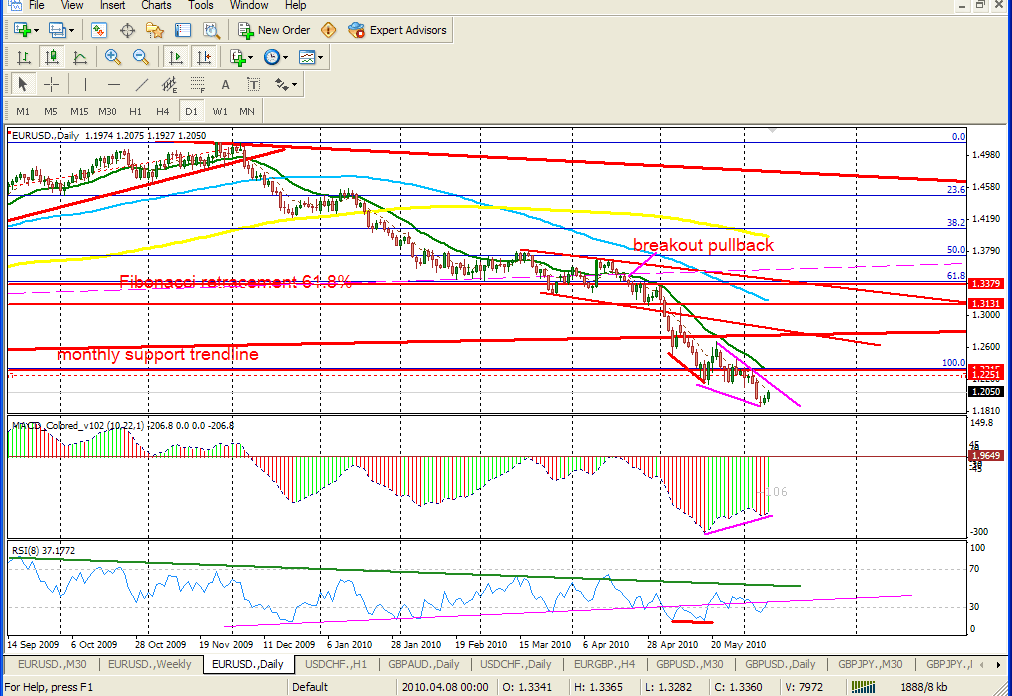
today eur usd monthly 04/06/2010 support 200sma or 1.2000-1.1980

today eur usd 30 min breakout, evening star candle,09/06/2010 buy 1.2000 stoploss 1.1940


today eur usd daily 09/06/2010 , evening star candle, Divergence, 
today eur usd 4hour breakout 25/06/2010


READ MORE - today eur usd

today gbp usd

Monday, June 14, 2010

today gbp usd 30 min 13/04/2010 buy1.5370 stoploss 1.5330 target 1.5500-1.5700
today gbp usd 4h ,breakout ,macd tc ,candle morningstar   01/06/2010 buy1.4560 stoploss 1.4450


today gbp usd 30 min 02/06/2010 ,morningstar candle ,macd green,rsi 30 and 1 bar ,volume 13 ema ,fibo 61.8%, 200sma,buy 1.4590 stoploss1.4550 target 21 ema or 1.4640


today gbp usd 5min 02/06/2010,three Divergence ,morningstar candle,buy 1.4590 stoploss1.4550 target 21 ema or 1.4640


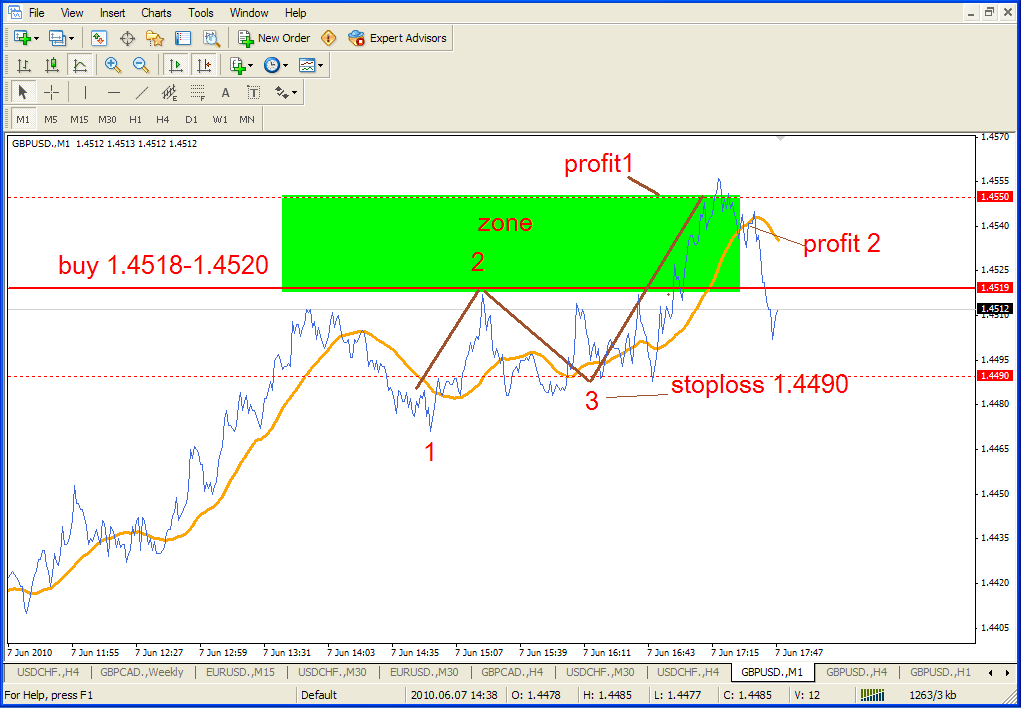
today gbp usd 7/06/2010 1min strategy Attacking Support and Resistance buy 1.4518-1.4520 stoploss 1.4480-1.4490 profit 21ema
today gbp usd 4h 7/06/2010

today gbp usd 4hour 10/06/2010 , evening star candle,

breakout,buy 1.4600 stoploss 1.4500 ,profit 200 sma or fibo 38%


                                                         today gbp usd 4hour 14/06/2010 , breakout,buy 1.4750 stoploss 1.4650


READ MORE - today gbp usd

today usd chf

Thursday, June 3, 2010


today usd chf 4h 13/04/2010 sell 1.0570 stoploss 1.0770
today usd chf 27/04/2010 1min strategy Attacking Support and Resistance

today usd chf 30min breakout 27/04/2010


today usd chf 4h 27/04/2010

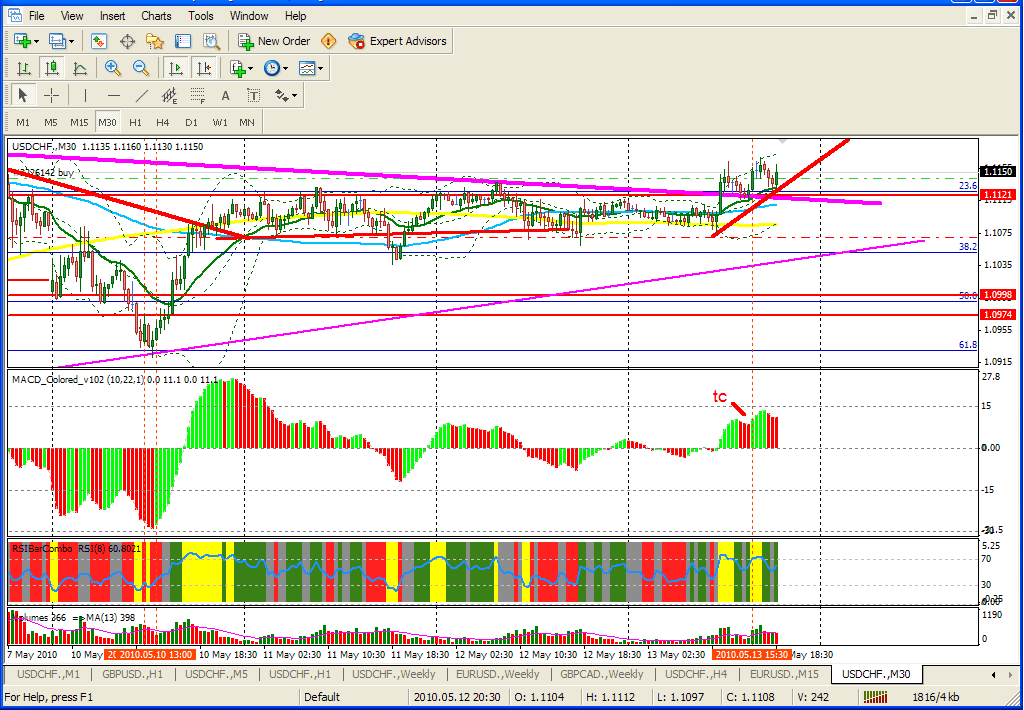
today usd chf 30min breakout 13/05/2010
today 30min 27/05/2010 buy 1.1620-1.1630 stoploss1.1550-1.1570 tp 1 1.1700


today 30min 03/06/2010 morningstar candle ,trendline,macd Divergence, buy 1.1548 stoploss1.1500 (no trading) be
today eur usd 30min 03/06/2010, support


READ MORE - today usd chf

Market Rhythm

Thursday, May 6, 2010

The market has a rhythm that if recognized can make trading so much easier. It is
something that must be learned over time and take a while to master. But when that is
achieved the resulting effect on trading is enormous. So look at the next video and make
sure you understand the concept. That will also help you to stretch some profit targets
when trading the MLTS. You can set the moving average as the profit target if that is
better then the Secondary level Profit target. When the secondary level profit target is
breached the moving average according to the market rhythm will then be the next target.
Please copy this link to your browser to play back your recording:
Recording Name: 4Hour Rhythm
These videos are not part of the selling price but were added as a bonus. They
are hosted on the www.gatherplce.net servers and are therefore depended
on their server availability as well as server loads. Check your firewall
settings in case of difficulty viewing. We have found some overload at times.
Just try again. Sometimes the video starts without voice. Just exit and retry
again. The videos have been tested and they are working when all is going well.
SOME CAUTION
I have to tell you this. The smaller the timeframe is used the more false breakouts
occur. As we are trading breakouts in the direction of the overall market condition
the smaller the timeframe the more percentage false breakouts occur. I have
spoken to some hedge fund traders and they do hunt stops. That is what I have been told.
There is however a very good way to trade these false breakouts. I will show a few. If this approach is traded the success rate is very high although much less trades.This is how it works.
1. We don’t take any breakout trades. We wait for a pullback into the pattern (in
our example a triangle) and enter at point “a” with our stoploss at point “b”.
2. The stops of those that took the breakout trade is normally at point 1,2 or 3
depending on how aggressive or conservative they approach the trade.
Sometimes there will only be one stoploss place and sometimes there will be
two. We will look into some examples later on.
3. Our take profit targets is set at those stoploss places that are under attack.
4. Our Risk:Reward ratio needs to be at leas 1:1.2 minimum.
5. First determine the stoploss size and then determine if we can get a R:R ratio
that is better then 1:1 to the stoploss placement of those that took the breakout trade.
6. Secure a breakeven situation as soon as 50%-60% of profit target is reached.7. If the speed is quick and it goes on then ride the tide or take some profit after  50%-60% and give the remainder a chance to ride. Waiting for a news announcement and there was an attempted break to the


downside before the news and must not be seen as a false breakout but rather an attempt


to get the trigger happy to enter before the time. The real breakout came at the black


arrow with the stops most likely at no 1, 2 or 3. Then the price retraced back into the


pattern with our entry at “a”, stop at “b” and profit target at “c”. Stoploss 2 and 3 falls


outside our 1:1 risk/reward ratio therefore we only have one profit target and that is at


stoploss number 3. Look how the price tested the upper trendline exactly and then break


the bottom trendline. That is now the correct direction as the hunting was over and now


you can enter and use the gain you made as a stoploss.


That was a 25pip up gain and a 30pip down gain.
Profit target was reached with the Multi Level System as discussed.
Look at this setup. 25Pips trading the hunting and 40pips trading the MLS after the true


breakout.


Another handing out of balls just to collect them again. They can see the depth of


orders and they knew that there were some orders at the bottom of the channel and


price will always move to where the demand is lying. They were not worried as there


stops are way below the bottom channel. If you see something like this on a 4Hour chart


you know that there is something big coming and you can position yourself to take
advantage of it.
Look how there was two attempts of a breakout at “Z”. Stops was most likely at


“X” and “Y”. There were breakout orders picked up on 2 occasions and both stoploss


levels were taken out. That was a golden opportunity to get some hunting pips in the bag.


Lets see it on the 15min timeframe.
1hour chart
False breakout to the bottom and then a true breakout to the top. +90 Pips.


Caution


Look for patterns that has some sort of length in terms of candles. Don’t use a short


pattern formed over only a few candles. Give it a fair chance to build up.
This pattern on the 15min chart is worth 13pips so don’t even consider it. Make sure you


have enough pips to have a fair chance and if there is a lot of emotion build into the


pattern formed over some time. There is no rule to determine that. With time you will see


the building up and know that they might do some shaking out. If you spot one on the


1hour it is worth looking at it on the 15min as your secondary level setup and take it from


there trying to get the hunting portion as well as the true breakout part.

READ MORE - Market Rhythm

1min strategy Attacking Support and Resistance

Saturday, May 1, 2010

The Method:

The main aim of this strategy is to allow the user to use
1 min strategy price chart and enter at predefined areas determined
when the trader starts his/her day of trading on different
currency pairs.
This 1 min strategy ASR strategy (ASR-Attacking Support and
Resistance) has the advantaged that those areas will be
known beforehand and is only entered when the specific area
are approached and the setup criteria is met.
The amount of pips obtainable with the ASR are in the region
of 10-100pips depending on the strength of the move
especially when it is news driven. The trader will also know              when to close the trade.
This also fits nice into the MLTS as discussed up to now. If
you have missed a trade in the MLTS you can always
captures some pips as the price moves towards the Profit
Target using the1 min strategy to attack that level. The main thing to
take into account is that the Risk:Reward must never be less
then 1:1. As long as that ratio is maintained you will make
money.
Never use more then 1,5% of your capital as
risk with the 1 min strategy ASR strategy until you are
comfortable trading it.This 1min strategy also satisfy the need for trading. We are human and

when we sit to trade we want to trade. Patience is one of the destroyers of an
account. We don’t want to wait so we look for trades and get burned more
then often. This 1 min strategy gives us the opportunity to satisfy that
need while our risk remains small enough not to get wiped out.
This strategy is exactly what the title is saying. It is all about
determining some support and resistance levels and then to attack
those levels. It differs in the sense that we are not going to trade off
the support and the resistance but rather towards them.


That means that we are going to determine before the day


starts where support and resistance is likely going to occur. Then we mark a


price range 30-50 pips away from the support/resistance.


What we are then looking for is for the price to move into that price range


and then we look at the 1 min strategy chart to enter at a certain setup we will discuss


later on. We then stay in the trade and exit the trade according to the rules as


explained later.


We are going to use a 4hour chart to determine the support


and resistance levels that might be tested and then mark our areas,


then change to the 1 min strategy chart and WAIT for action.


All indicators used is standard indicators found in most


software used for trading Forex. We can make use of an alert setup


to warn us when the price is nearing the marked area so we don’t


have to be in front of the computer all the time. We can be in the


vicinity doing other things and only draw closer when the alert goes


off. We then watch for the setup and finish the trade according to the rules.


We also don’t want to overtrade by watching to many pairs and


entering to many trades. I have only used the EurUsd and the


GbpUsd and I will decide on one of the two when the trading area is approach.


Sometimes the EurUsd will be there first and sometimes the GbpUsd first. I


have tried to only trade 3 trades per day.


You as a trader may test this on any pairs you would like to trade as the


support and resistance levels works the same for all pairs.
The INGREDIENTS:


On a 4H chart plot the following Moving Averages


1. 200 simple moving average


2. 89 simple moving average


3. 21 exponential moving average


On a 1 min strategy Chart plot a 34 simple moving average


If you haven’t watch the video yet please do so now before going


further.


Please copy this link to your browser to play back your recording:


http://www.gatherplace.net/play?25198708


Recording Name: 4Hour Rhythm
THE METHOD:


Now for the method to determine the support/resistance we


must understand the role the 3 moving averages are playing in the


4Hour timeframe. You will find that the price is finding support and or


resistance on and against these moving averages quite amazingly.


Lets look at some examples of it.


If you look at the chart you will notice how many times have the price


moved towards those moving averages. This is where the key to this


strategy is nested. Because the price is going to those moving


averages very often we can mark a price area 30-50pips away from


those moving averages and then use the 1 min strategy to enter a trade with


our initial profit goal round about the moving average. At this stage I only


want you to see the potential of the price moving towards those


moving averages as I have not marked everyone on the chart included.


The idea was not to show every move towards


support/resistance in the examples but rather to gave you the idea of


the concept.


Lets do some more examples
Example 1:


Here you can see that the price is moving towards the moving averages


quite often in a span of 4 weeks. That creates opportunities for trading


using the 1 min strategy ASR strategy                    


Example 2:
Here is a video link to the 1 min strategy ASR strategy that you can watch
Please copy this link to your browser to play back your recording:
http://www.gatherplace.net/play?47083658
Recording Name: 1Min ComboBox


Lets look at areas marked A – F individually.


A. The downtrendline was broken and the odds were good for


the price to move towards the 21ema creating an opportunity


for a long trade


B. When the price reached an area with the price rising just


below the 21ema the signal candle as well as the previous red


candle had tails on them creating a possibility of a retest of the


21ema. An area of 30-50 pips could be marked for a possible


trade.


C. The price formed an inverted red hammer and when the price


moved above the high of that hammer (brown horizontal line)


the odds were high that the price might move up to the 21ema


once again creating an opportunity to trade.


D. After a huge bullish candle the odds were high that the 89sma


might be tested creating yet another opportunity to trade.


E. With the price moving above the 89sma we know that the


price very often comes back to retest the 89sma and when that


tail was busy forming the odds were good that the 89sma


might be tested creating 1 min strategy ASR trade opportunity.


F. Here we had a doji candle as well as a shooting star


indicating a possible downmove which creates ones again an


opportunity for an ASR trade down to the 89sma.


By now you must have grasped what there is to look for when


using the moving averages as support and resistance and the


marking of the areas.


It is very important also to recognize the candle emotion prior to


the signal candle like hammers, morning/evening stars,


shooting stars, bullish/bearish engulfing etc. to determine the


intension of the move to go the way as anticipated.
Sometimes there are barriers for the price to overcome to be able to


reach the desired moving average as anticipated. And they are equal


price levels like 1,3500--1.2900—1.4000 etc. They play a major role as


the price will try to find support and or resistance at those levels as


well. When these price levels are in the way to a moving average the


trader must take that into account that the price might turn around at


those levels or stay there for some time before getting direction again.


Therefore when in a trade then take caution by either securing a non


loss situation by moving the position to breakeven or move the


stoploss to a profit exit at least should the price turn around.


Another barrier are trendlines. Trendlines of supp/res in the way to a


moving average must also be taken into account. Those trendlines


also act as possible profit taking zones. Trendlines is also


oppertunities for some ASR trades.
Look how trendlines can be used to marked areas for possible ASR


trades. Points 1 to 5 is necessary for the trendlines to be defined and


cannot act as possible areas.


See if you can spot some other areas around the different moving


averages as discussed previously on this same chart and see for


yourself how many opportunities does occur and if traded how many


trades can be made.
In the next chart the areas was marked and we will look in more depth

what happens on the 1 min strategy chart at those levels.
At area marked A you can see how the price is interacting at the price


levels before getting direction. Thos red marked areas


But here we have another opportunity coming our way and that is if the


price have a high probability to move to the 4Hour 200sma and


there are some price levels in between we can marked those areas


just as the chart below indicates giving us another 1 min strategy ASR


entries.
                                    4 Hour Chart As you can see that the price went


down to the 200sma on the 4Hour


crossing 3 price levels each one


creating an opportunity to have a


1 min strategy ASR trade. The last 30-50


pips approaching the price level


are ideal to have an area marked


as indicated on the 1min chart


giving as ASR trade


opportunities.
At area marked B you can see how the price is interacting at the price


levels before getting direction. That red marked area
A lot of pages just to get the concept of the areas under the belt.


But now we come to the meat of the 1Min Attacking Support and


Resistance levels and that is the Entry, Stoploss and Exit rules.


Entry, Stoploss and Takeprofit:


The entry is based upon an old entry method called the 123 method.


When the price are at the marked area we start to look for a 123 setup to


form and enter the trade on that bases.


As you can see on the chart below that in a 123 setup point no 3 must be


lower then point 1 for a short trade and the price have to surpass point


2 for point 3 to be formed. Entry is made when the 1 min candle closes


below point 2. Take profit depends on the speed of the market but the


34sma acts as a very good place to close the trade should it being


breached.
Price have to surpass point 2 for point 3 to be formed
Quite surprised that the meat of the system is merely one page. The whole


success of the method is the determination of the areas and needs


some practice.


The entry, exit and profit taking setups for a long entry is just the inverse


of what is described on previous page.


We will now move to some examples of trades and areas marked.


In the example below the anticipation was for the price to bounce off the


bottom trendline and to go to the 21ema on the 4Hour. That area is


then marked on the 1Min chart as indicated on the right hand chart


and entry was made according to our 123 method and take profit was


when the price crosses below the 34simple moving average.


Some more examples of entry, stoploss and exit trades.
 
The following few pages will show some areas marked as described


combining moving averages, trendlines and price levels.

Conclusion:


As you can see that by premarking the trade opportunity areas there is


plenty trades to be made on a weekly basis.


This 1min strategy also satisfy the need for trading. We are human and


when we sit to trade we want to trade. Patience is one of the


destroyers of an account. We don’t want to wait so we look for trades


and get burned more then often. This 1min ASR strategy gives us the


opportunity to satisfy that need while our risk remains small enough.


Now that you have worked through this you can see how this method can


also be used to Premark the areas using the Fib retracements and or


extensions on the 4Hour and even Daily charts as discussed on the


MLTS. There are plenty of opportunities to trade this method.
READ MORE - 1min strategy Attacking Support and Resistance

Horloge pour site Orologio per sito

News


Followers

Total Pageviews

ukraine brides contatore visite website counter
powered by PRBbutton
SEO Stats powered by MyPagerank.Net