READ MORE - breakout pullback
Label
- 1min strategy Attacking Support and Resistance (1)
- 30 Minute Break out (7)
- 30 Minute Breakout (3)
- 30 Minutes Breakout (1)
- 4 Hour Breakout (8)
- 4H MACD PRICE MOVEMENT RULES (1)
- 4Hour Rhythm strategy (1)
- Breakout candle trading 30 min 4 hour (1)
- breakout pullback (1)
- Candle 30 min breakout (2)
- Candlestick Patterns Trading System (1)
- Daily Breakout (1)
- Exercise macd trading system (1)
- Fibonacci Trading (1)
- Forex System Money Management (1)
- Macd Signals (1)
- Market Emotion (1)
- Market Rhythm (1)
- News Trading (1)
- Rhythm Trading (1)
- Stoploss (1)
- Technical vs Fundamental (1)
- today eur usd (1)
- today eur usd 15/07/2010 (1)
- today gbp usd (1)
- today usd chf (1)
- Trade breakout And Trend Breakout (1)
- Trading About Trend System Trade System (1)
- trading plan (1)
- Trading System (1)
- Tsunami (1)
- Why most people lose money in the forex market (1)
Popular Posts
-
(Symbol yellow) breakout pullback ,Perfect very good ,usd chf daily 27 04 2010 breakout30min ...
-
Rule number 1. Your focus should be around the price movement in relations to: 1.1 MA, trendlines, support and resistance levels and big n...
-
Market Rhythm 4 Hour Strategy I.1 Beginning of the UP Trend Trading System When the price goes through the 89SMA it trend trading system t...
-
The Method: The main aim of this strategy is to allow the user to use 1 min strategy price chart and enter at predefined areas determined...
-
Right. Let's look at that I've included there. It's about... I call it rhythm trading. Page 1, that triangle. We had three TC s...
-
Candle 30 min Breakout Use EUR/USD AND GBP/USD Only Trade Must Be In 3 Days Up More In this candle 30 min breakout strategy system we are ...
-
4 Hour Breakout EUR/USD 18/02/2011 4 Hour Breakout trend line ok candle morningstar1 hour breakout system pullback price up trendline an...
-
today eur usd Daily 12/04/2010 buy 1.3450-1.3550 stoploss1.3300 target 1.4000-1.4600 ...
-
Candle 30 Minute Break out today gbp/usd 4/05/2011 30 Minute Break out , price pullback very good ,volumes very and macd tc ok, buy 1.6540 s...
-
GBP/USD candle Daily Breakout pullback,trendline support 3 point up and Time of More than a year.wait time trading candle 30 Minute Break ...
breakout pullback
Tuesday, April 20, 2010Posted by Bermudathai at 4/20/2010 08:51:00 AM 0 comments
Labels: breakout pullback
Trend Breakout And 15 min Breakout Trading
Monday, April 19, 2010
The distribution after 100 backtesting trades is distributed as on
the data table. The Risk:Reward is a minimum 1:1 with 2 trades running to a 1:2 ratio. A lot of trades was closed at a ratio less then 1:0,6 as the price failed to enter the profit target zone. Some trades were closed
when the price halted inside the zone not going to the 1:1 ratio and was
closed inbetween mostly at 1:0,8. Then some trades was closed at 1:1,5
and 1:1,7 when the 1:2 ratio was not reached.
This table is only an indication as I have done it. Yours might
differ totally according to where you will take profit if the target zones
are not met. Do some testing and make your own distribution.
The loss:win ratio is 38% to 62% according to the backtesting that
I have done. Depending on how you are going to handle and close
trades if the target zone is not met will enhance the winning ratio even more Based upon the distribution as obtained by historical trades an odds simulation can be run to determine a possible
outcome trades based upon that distribution. This will show what is the chances of success for this strategy based upon the
distribution.The above table was obtained with 100 trades starting with a $500 account and 3% risk with the
distribution as per page 2.
After 400trades and 24 months later (±16 trades per month) a starting balance of $500 has grown to
just over $3000 risking not more then 3% of capital. This is the foundation of trading. To have a
system that beat the odds and then manage the downside well and it will produce a good return over
time.This is a simulated result based upon the distribution as per page 2.


The next couple of slides shows roughly some trades to give an idea of the how the 15min can give
nice breakout trades with the odds in your favor applying the MLTS principal.
READ MORE - Trend Breakout And 15 min Breakout Trading
the data table. The Risk:Reward is a minimum 1:1 with 2 trades running to a 1:2 ratio. A lot of trades was closed at a ratio less then 1:0,6 as the price failed to enter the profit target zone. Some trades were closed
when the price halted inside the zone not going to the 1:1 ratio and was
closed inbetween mostly at 1:0,8. Then some trades was closed at 1:1,5
and 1:1,7 when the 1:2 ratio was not reached.
This table is only an indication as I have done it. Yours might
differ totally according to where you will take profit if the target zones
are not met. Do some testing and make your own distribution.
The loss:win ratio is 38% to 62% according to the backtesting that
I have done. Depending on how you are going to handle and close

outcome trades based upon that distribution. This will show what is the chances of success for this strategy based upon the
distribution.The above table was obtained with 100 trades starting with a $500 account and 3% risk with the
distribution as per page 2.
After 400trades and 24 months later (±16 trades per month) a starting balance of $500 has grown to
just over $3000 risking not more then 3% of capital. This is the foundation of trading. To have a
system that beat the odds and then manage the downside well and it will produce a good return over
time.This is a simulated result based upon the distribution as per page 2.


The next couple of slides shows roughly some trades to give an idea of the how the 15min can give nice breakout trades with the odds in your favor applying the MLTS principal.
Posted by Bermudathai at 4/19/2010 08:48:00 AM 0 comments
4H MACD PRICE MOVEMENT RULES
Friday, April 9, 2010
Rule number 1. Your focus should be around the price movement in relations to:
1.1 MA, trendlines, support and resistance levels and big numbers. 1.2 Then look for the MACD to confirm signals.
2. Homework on price movement should have been done before looking at the MACD signal
3. Don’t take every MACD signal.
4. Don’t jump around ten pairs.
4.1 Stay with the minimum and keep track of their price movement (as stipulated in Rule 9-11)
5. Look at market emotions – candle formation at critical points on the chart will show emotions in the market
6. Wait for playing ground to be removed so that the market can get rhythm and definite direction
7. Go with the rhythm and trend of the pair.
8. Counter trend trade only when:
8.1 Near major Trend, Resistance and Support lines
8.2 RR is 1:1 or better
8.3 Towards the 21MA as profit target
9. When price break through the 89MA, it tends to move back to 21MA and then it moves on in that direction.
10. When price breaks through the 200SMA, it moves back to it before moving on.
11. When price breaks back through the 21MA it comes back to 21MA and then move on to the 89MA
READ MORE - 4H MACD PRICE MOVEMENT RULES
1.1 MA, trendlines, support and resistance levels and big numbers. 1.2 Then look for the MACD to confirm signals.
2. Homework on price movement should have been done before looking at the MACD signal
3. Don’t take every MACD signal.
4. Don’t jump around ten pairs.
4.1 Stay with the minimum and keep track of their price movement (as stipulated in Rule 9-11)
5. Look at market emotions – candle formation at critical points on the chart will show emotions in the market
6. Wait for playing ground to be removed so that the market can get rhythm and definite direction
7. Go with the rhythm and trend of the pair.
8. Counter trend trade only when:
8.1 Near major Trend, Resistance and Support lines
8.2 RR is 1:1 or better
8.3 Towards the 21MA as profit target
9. When price break through the 89MA, it tends to move back to 21MA and then it moves on in that direction.
10. When price breaks through the 200SMA, it moves back to it before moving on.
11. When price breaks back through the 21MA it comes back to 21MA and then move on to the 89MA
Posted by Bermudathai at 4/09/2010 10:37:00 PM 0 comments
Labels: 4H MACD PRICE MOVEMENT RULES
Fibonacci Trading
Saturday, April 3, 2010
The Truth About Fibonacci Trading The truth about Fibonacci levels is that they are useful (like all trading indicators). They do not work as a standalone system of trading and they are certainly not the “holy grail”, but can be a very effective component of your trading strategy.
But who is Fibonacci and how can he help you with your trading?
Leonardo Fibonacci was a great Italian mathematician who lived in the thirteenth century who first observed certain ratios of a number series that are regarded as describing the natural proportions of things in the universe, including price data. The ratios arise from the following number series: 1, 2, 3, 5, 8, 13, 21, 34, 55, 89, 144 ……
This series of numbers is derived by starting with 1 followed by 2 and then adding 1 + 2 to get 3, the third number. Then, adding 2 + 3 to get 5, the fourth number, and so on.
The ratios are derived by dividing any number in the series by the next higher number, after 3 the ratio is always 0.625. After 89, it is always 0.618. If you divide any Fibonacci number by the preceding number, after 2 the number is always 1.6 and after 144 the number is always 1.618. These ratios are referred to as the “golden mean.” Additional ratios were then derived to create ratio sets as follows:
The Truth About Fibonacci Trading
The first set of ratios is used as price retracement levels and is used in trading as possible support and resistance levels. The reason we have this expectation is that traders all over the world are watching these levels and placing buy and sell orders at these levels which becomes a self-fulfilling expectation.
The second set is used as price extension levels and is used in trading as possible profit taking levels. Again, traders all over the world are watching these levels and placing buy and sell orders to take profits at these levels which becomes a self-fulfilling expectation.
Most good trading software packages include both Fibonacci Retracement Levels and Price Extension Levels. In order to apply Fibonacci levels to price charts, it is necessary to identify Swing Highs and Swing Lows. A Swing High is a short term high bar with at least two lower highs on both the left and right of the high bar. A Swingof the high bar. A Swing
8.The Truth About Fibonacci Trading
Low is a short term low bar with at least two higher lows on both the left and right of the low bar.
1.Fibonacci Retracement Levels
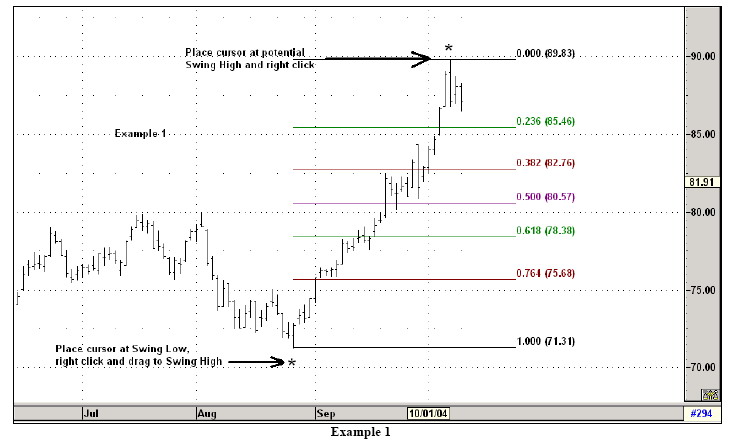
In an uptrend, the general idea is to go long the market on a retracement to a Fibonacci support level. The price retracement levels can be applied to the price bar chart of any market by clicking on a significant Swing Low and dragging the cursor to the most recent potential Swing High and clicking there. This will display each of the Retracement Levels showing both the ratio and corresponding price level. Let’s take a look at some examples of markets in an uptrend. The same points made by these examples are equally applicable to markets in a downtrend.
Example 1: Here we plotted the Fibonacci Retracement Levels by clicking on the Swing Low at about $71.31 and dragging the cursor to the Swing High at about $89.83. You can see the resultant levels plotted by the software. Now the expectation is that if the market retraces from this high it will find support at one of the Fibonacci Levels, because traders will be placing buy orders at these levels as the market pulls back.
The Truth About Fibonacci Trading
Example 1.1: Now let’s look at what actually happened after the Swing High occurred. The market pulled back right through the 0.236 level and continued the next day through the 0.382 level before finding support. After a few days, the market resumed its upward move. Clearly buying at the 0.382 level would have been a good short term trade.
Example 2: Again, the Fibonacci Retracement Levels were plotted on the chart in the same manner as described in Example 1. Again, we are looking for the market to retrace from the Swing High and find support at one of the Fibonacci levels.
Example 2.1: Now let’s look at what actually happened. The market again pulled back right through the 0.236 level and continued to pull back until it found temporary support at the 0.50 level (a lot of buyers at this level). However, once the buying power was exhausted, the market continued to retrace all the way down to the 0.764 level before resuming its upward trend. In this case, buying at the 0.764 level would have been a good short term trade.
The Truth About Fibonacci Trading
Example 3.1: Well, in this case the market found support at the 0.50 level. Buying at this level would have been a great trade as the market gapped up a few days later.
The Truth About Fibonacci Trading
Example 4: Here’s one more example.

Example 4.1: Whoops! The market gapped down through all levels of support and never looked back. A long trade here would have been a loser or at least an open lose position.
You can see from these examples that the market often finds at least temporary support at the Fibonacci Retracement Levels – not always, but often. It should be apparent that there are a few problems to deal with here. First, there is no way of knowing which level will provide support. The 0.236 level seems to provide the weakest support, while the other levels provide support with approximately the same frequency. Second, the market will not always resume its uptrend after finding temporary support, but instead continue to decline below
The Truth About Fibonacci Trading
the last Swing Low. Thirdly, placement of stops is a challenge – it is probably best to place stops below the last Swing Low, but this requires accepting a high level of risk in proportion to the likely profit potential in the trade. Another problem is determining which Swing Low to start from in creating the Fibonacci Retracement Levels. One way is from the last Swing Low as we did in the examples. Another is from the lowest Swing Low of the past 30 days. The point is, there is no one right way to do it, and consequently it becomes a guessing game.
The Truth About Fibonacci Trading
Fibonacci Price Extension Levels
In an uptrend, the general idea is to take profits on a long trade at a Fibonacci Price Extension Resistance Level. The Price Extension Levels can be applied to the price bar chart of any market by clicking on a significant Swing Low and dragging the cursor to the most recent Swing High. Then by clicking on the Swing High and back down to the retracement Swing Low and clicking there. This will display each of the Extension Levels showing both the ratio and corresponding price level. Let’s take a look at some examples of markets in an uptrend. The same points made by these examples are equally applicable to markets in a downtrend.
Example 5: Here we plotted the Fibonacci Price Extension Levels by clicking on the Swing Low at about $38.20 and dragged the cursor to the Swing High at about $47.67 and then down to the retracement Swing Low. You can see the resultant levels plotted by the software. Now the expectation is that if the market continues higher it will find resistance at one of the Fibonacci Levels, because traders will be placing sell orders at these levels to take profits on there long trades.
Example 5.1: Now let’s look at what actually happened after the retracement Swing Low occurred. The market rallied making new highs pausing at the 0.382 level and again at the 1.000 level after a retracement down it rallied again going right through the 1.382 and 1.618 levels. Taking profits at the 0.382 level would have been premature, but taking profits at the 1.000 level would have made a nice trade.
The Truth About Fibonacci Trading
Example 6: Again, the Fibonacci Price Extension Levels were plotted on the chart in the same manner as described in Example 5. Again, we are looking for the market to continue higher before finding resistance at the Fibonacci Levels.

Example 6.1: Now let’s look at what actually happened. The market rallied, making new highs and pausing between the 0.382 level and the 0.618 level, and then continued higher. This up move could well continue up to at least the 1.000 level. Taking profits at the 0.382 level would have been premature and only time will tell if taking profits at the 0.618 level was the optimal place to exit the long trade.
The Truth About Fibonacci Trading
Example 7: Here’s another example. Will the market continue higher to one of the Fibonacci Price Extension Levels?
The Truth About Fibonacci Trading
Example 7.1: Well in this case the market found resistance at the 0.382 level which would have been the place to take profits on any long trades
The Truth About Fibonacci Trading
Example 8: Here’s one more example.
The Truth About Fibonacci Trading
Example 8.1: Like the last example, the market found resistance at the 0.382 level which would have been the place to take profits on any long trades.
You can see from these examples that the market often finds at least temporary resistance at the Fibonacci Extension Levels - not always, but often. As in the examples of the Retracement Levels, it should be apparent that there are a few problems to deal with here as well. First, there is no way of knowing which level will provide resistance. The 0.382 level was a good level to cover any long trades in two of the examples, but in the other examples taking profits at that level would have been premature. Another problem is determining which Swing
The Truth About Fibonacci Trading
Low to start from in creating the Fibonacci Extension Levels. One way is from the last Swing Low as we did in the examples; another is from the lowest Swing Low of the past 30 days. Again, the point is that there is no one right way to do it, and consequently it becomes a guessing game.
Alone, Fibonacci Levels will not make you rich. However, Fibonacci Levels are definitely useful as part of an effective trading method that includes other analysis and techniques. You see, the key to an effective trading system is to integrate a few indicators (not too many) that are applied in a way that is not obvious to most observers. All successful traders know it’s how you use and integrate the indicators (including Fibonacci) that makes the difference. The lesson learned here is that Fibonacci Levels can be a useful tool, but never enter or exit a trade based on Fibonacci Levels alone.
Good luck trade
READ MORE - Fibonacci Trading
But who is Fibonacci and how can he help you with your trading?
Leonardo Fibonacci was a great Italian mathematician who lived in the thirteenth century who first observed certain ratios of a number series that are regarded as describing the natural proportions of things in the universe, including price data. The ratios arise from the following number series: 1, 2, 3, 5, 8, 13, 21, 34, 55, 89, 144 ……
This series of numbers is derived by starting with 1 followed by 2 and then adding 1 + 2 to get 3, the third number. Then, adding 2 + 3 to get 5, the fourth number, and so on.
The ratios are derived by dividing any number in the series by the next higher number, after 3 the ratio is always 0.625. After 89, it is always 0.618. If you divide any Fibonacci number by the preceding number, after 2 the number is always 1.6 and after 144 the number is always 1.618. These ratios are referred to as the “golden mean.” Additional ratios were then derived to create ratio sets as follows:
The Truth About Fibonacci Trading
The first set of ratios is used as price retracement levels and is used in trading as possible support and resistance levels. The reason we have this expectation is that traders all over the world are watching these levels and placing buy and sell orders at these levels which becomes a self-fulfilling expectation.The second set is used as price extension levels and is used in trading as possible profit taking levels. Again, traders all over the world are watching these levels and placing buy and sell orders to take profits at these levels which becomes a self-fulfilling expectation.
Most good trading software packages include both Fibonacci Retracement Levels and Price Extension Levels. In order to apply Fibonacci levels to price charts, it is necessary to identify Swing Highs and Swing Lows. A Swing High is a short term high bar with at least two lower highs on both the left and right of the high bar. A Swingof the high bar. A Swing
8.The Truth About Fibonacci Trading
Low is a short term low bar with at least two higher lows on both the left and right of the low bar.
1.Fibonacci Retracement Levels
In an uptrend, the general idea is to go long the market on a retracement to a Fibonacci support level. The price retracement levels can be applied to the price bar chart of any market by clicking on a significant Swing Low and dragging the cursor to the most recent potential Swing High and clicking there. This will display each of the Retracement Levels showing both the ratio and corresponding price level. Let’s take a look at some examples of markets in an uptrend. The same points made by these examples are equally applicable to markets in a downtrend.
Example 1: Here we plotted the Fibonacci Retracement Levels by clicking on the Swing Low at about $71.31 and dragging the cursor to the Swing High at about $89.83. You can see the resultant levels plotted by the software. Now the expectation is that if the market retraces from this high it will find support at one of the Fibonacci Levels, because traders will be placing buy orders at these levels as the market pulls back.
The Truth About Fibonacci Trading
Example 1.1: Now let’s look at what actually happened after the Swing High occurred. The market pulled back right through the 0.236 level and continued the next day through the 0.382 level before finding support. After a few days, the market resumed its upward move. Clearly buying at the 0.382 level would have been a good short term trade.
Example 2: Again, the Fibonacci Retracement Levels were plotted on the chart in the same manner as described in Example 1. Again, we are looking for the market to retrace from the Swing High and find support at one of the Fibonacci levels.
Example 2.1: Now let’s look at what actually happened. The market again pulled back right through the 0.236 level and continued to pull back until it found temporary support at the 0.50 level (a lot of buyers at this level). However, once the buying power was exhausted, the market continued to retrace all the way down to the 0.764 level before resuming its upward trend. In this case, buying at the 0.764 level would have been a good short term trade.
The Truth About Fibonacci Trading

Example 3.1: Well, in this case the market found support at the 0.50 level. Buying at this level would have been a great trade as the market gapped up a few days later.

Example 4: Here’s one more example.

The Truth About Fibonacci Trading
Example 4.1: Whoops! The market gapped down through all levels of support and never looked back. A long trade here would have been a loser or at least an open lose position.

The Truth About Fibonacci Trading
the last Swing Low. Thirdly, placement of stops is a challenge – it is probably best to place stops below the last Swing Low, but this requires accepting a high level of risk in proportion to the likely profit potential in the trade. Another problem is determining which Swing Low to start from in creating the Fibonacci Retracement Levels. One way is from the last Swing Low as we did in the examples. Another is from the lowest Swing Low of the past 30 days. The point is, there is no one right way to do it, and consequently it becomes a guessing game.
The Truth About Fibonacci Trading
Fibonacci Price Extension Levels
In an uptrend, the general idea is to take profits on a long trade at a Fibonacci Price Extension Resistance Level. The Price Extension Levels can be applied to the price bar chart of any market by clicking on a significant Swing Low and dragging the cursor to the most recent Swing High. Then by clicking on the Swing High and back down to the retracement Swing Low and clicking there. This will display each of the Extension Levels showing both the ratio and corresponding price level. Let’s take a look at some examples of markets in an uptrend. The same points made by these examples are equally applicable to markets in a downtrend.
Example 5: Here we plotted the Fibonacci Price Extension Levels by clicking on the Swing Low at about $38.20 and dragged the cursor to the Swing High at about $47.67 and then down to the retracement Swing Low. You can see the resultant levels plotted by the software. Now the expectation is that if the market continues higher it will find resistance at one of the Fibonacci Levels, because traders will be placing sell orders at these levels to take profits on there long trades.
Example 5.1: Now let’s look at what actually happened after the retracement Swing Low occurred. The market rallied making new highs pausing at the 0.382 level and again at the 1.000 level after a retracement down it rallied again going right through the 1.382 and 1.618 levels. Taking profits at the 0.382 level would have been premature, but taking profits at the 1.000 level would have made a nice trade.
The Truth About Fibonacci Trading


The Truth About Fibonacci Trading
Example 6.1: Now let’s look at what actually happened. The market rallied, making new highs and pausing between the 0.382 level and the 0.618 level, and then continued higher. This up move could well continue up to at least the 1.000 level. Taking profits at the 0.382 level would have been premature and only time will tell if taking profits at the 0.618 level was the optimal place to exit the long trade.

Example 7: Here’s another example. Will the market continue higher to one of the Fibonacci Price Extension Levels?

Example 7.1: Well in this case the market found resistance at the 0.382 level which would have been the place to take profits on any long trades

Example 8: Here’s one more example.

Example 8.1: Like the last example, the market found resistance at the 0.382 level which would have been the place to take profits on any long trades.

The Truth About Fibonacci Trading
Low to start from in creating the Fibonacci Extension Levels. One way is from the last Swing Low as we did in the examples; another is from the lowest Swing Low of the past 30 days. Again, the point is that there is no one right way to do it, and consequently it becomes a guessing game.
Alone, Fibonacci Levels will not make you rich. However, Fibonacci Levels are definitely useful as part of an effective trading method that includes other analysis and techniques. You see, the key to an effective trading system is to integrate a few indicators (not too many) that are applied in a way that is not obvious to most observers. All successful traders know it’s how you use and integrate the indicators (including Fibonacci) that makes the difference. The lesson learned here is that Fibonacci Levels can be a useful tool, but never enter or exit a trade based on Fibonacci Levels alone.
Good luck trade
Posted by Bermudathai at 4/03/2010 07:27:00 PM 0 comments
Labels: Fibonacci Trading
Subscribe to:
Posts (Atom)


